Data Collection Diffuse Scattering Blog
Varying crystallization conditions to study lattice effects on diffuse scattering
4 min read
Words by:

Katie LuUndergraduate Researcher at Cornell
This summer, I worked on a diffuse scattering project within the Ando Lab, focusing on the protein SARS-CoV-2 NSP3 macrodomain (Mac1). This protein is a virulence factor in SARS-CoV-2 that disrupts ADP-ribosylation and helps the virus resist the host immune response. To further explore this protein, we aimed to study what effects different crystallization conditions could have on its diffuse scattering. The plan was to first crystallize and optimize the protein in different conditions, then collect diffuse scattering data, determine crystal structures, and analyze what effects differences in the crystal structures arising from crystallization could have on diffuse scattering.
High-throughput screening
The first step of this experiment was finding different Mac1 growth conditions through crystallographic screening. The protein has previously been crystallized in several space groups, including P43 and C2, as reported in a 2022 Fraser Lab paper (PDB IDs 7KQO and 7KR1, respectively)1. The aforementioned two constructs, Mac1 P43 purified by Kara Zielinski and Mac1 C2 purified by Alex Wirganowicz, were used for sitting-drop vapor diffusion screening. Four 96-well screens from Hampton Research (Index HT, PEGRx HT, PEG/Ion HT, PEG/pH HT) were primarily used for the crystallization conditions. The proteins were first screened without seeding, and then with microseeding using crystals grown in the previous unseeded trays. Trays with the Mac1 P43 construct were highly productive. Before seeding, the trays produced 8 potential hits in total; after seeding, that number climbed to 54. In contrast, the C2 construct did not crystallize as readily, with the unseeded trays yielding 0 hits total. Because the screening trays produced no hits, crystals from those trays could not be used for microseeding. Instead, we used crystals from an earlier hanging-drop tray following the conditions described in the 2022 paper1. Subsequently, there appeared to be 1 potential hit.
Phase diagrams
Next, the focus of the project shifted to optimization using phase diagrams. Optimizing to produce very large crystals is critical to achieve interpretable diffuse scattering signals. This summer, the Ando Lab obtained a Douglas Instruments Oryx 8 crystallization robot, which makes setting up crystallization plates more efficient. One of the robot’s features is producing phase diagrams, where the protein concentration is plotted against the precipitant concentration; here, the precipitant was the crystallization cocktail (Figure 1).
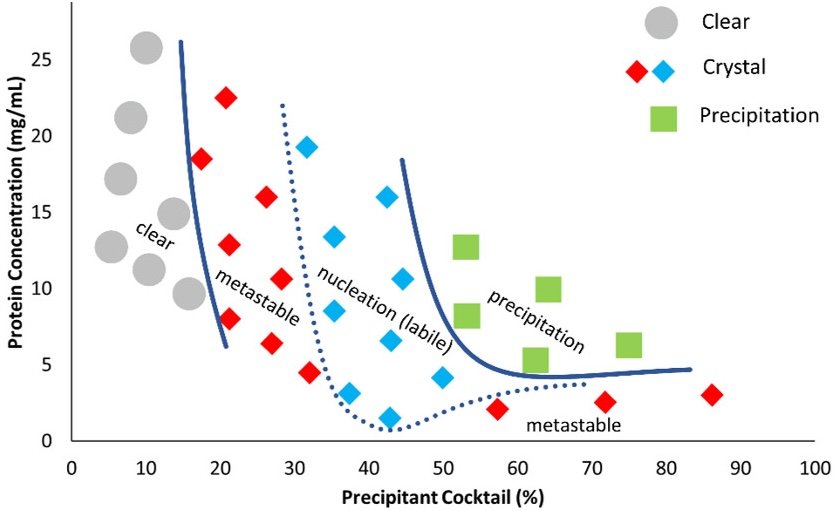
Figure 1. An example of a crystallization phase diagram with four clearly defined regions. From Douglas Instruments Automated Phase Diagram.
To produce phase diagrams, the robot makes two trays, one unseeded and one microseeded. Phase diagrams are beneficial because they help identify the ideal concentrations of protein and precipitant for crystal growth. The target region in phase diagrams is where there is crystal growth but no spontaneous nucleation, meaning that aggregation should result in larger crystals and not more numerous ones. This region is referred to as the “metastable zone”. To observe this region, one should see a clear drop in the unseeded plot and a drop with crystals in the microseeded plot.2 Furthermore, to better visualize the concentrations for growth, phase diagrams were created using microbatch-under-oil with 100% paraffin oil instead of vapor diffusion, since vapor diffusion relies on changing concentrations.
A total of eleven phase diagrams were created based on conditions from the crystallization screens over the summer. We represented the phase diagrams in two ways: first, with microscope images of the unseeded and microseeded phase diagrams (Figure 2), and second with a scatter plot to make the boundaries between regions clearer (Figure 3). Generally, the phase diagrams reflected the expected pattern of having more crystals in the microseeded condition. However, defining the regions was still not perfectly straightforward as not every drop was obviously categorized as categorized as clear drops, drops containing crystals, or drops containing precipitate. For instance, under white light illumination, it was hard to tell whether some drops contained a light granular precipitate or microcrystals. More advanced imaging could help resolve this issue by distinguishing between the two.
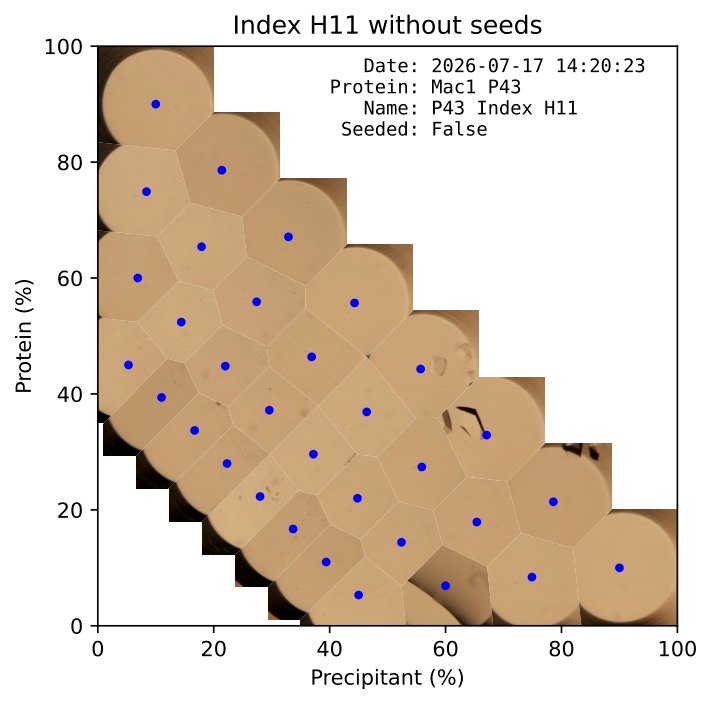
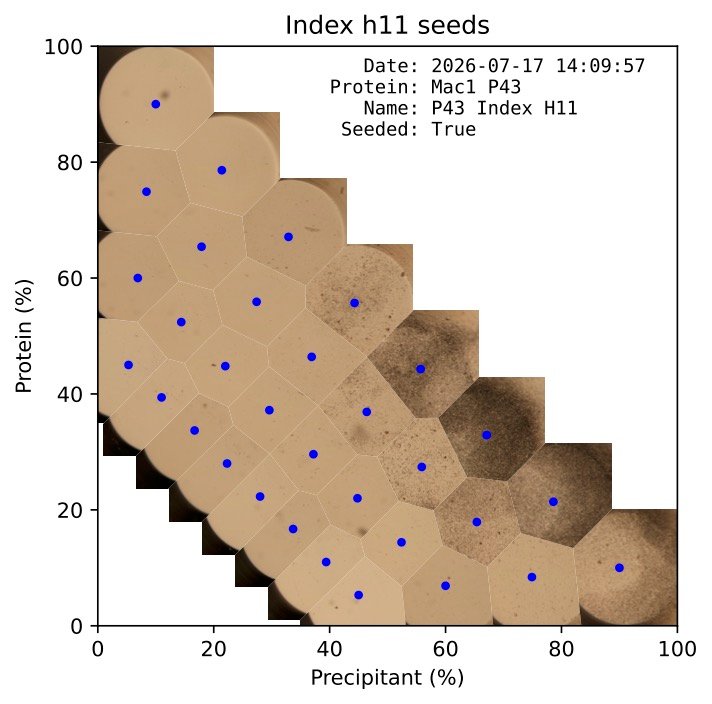
Figure 2. Crystallization phase diagram for Mac1 based on the hit condition from Index HT screening tray well H11 (0.1 M potassium thiocyanate, 30% w/v PEG monomethyl ether 2000). Microscope images have been cropped and overlaid on dots (blue) representing the concentration of protein and precipitant corresponding to each image. The image on the right shows the same experiment with seeds added to the precipitant solution.
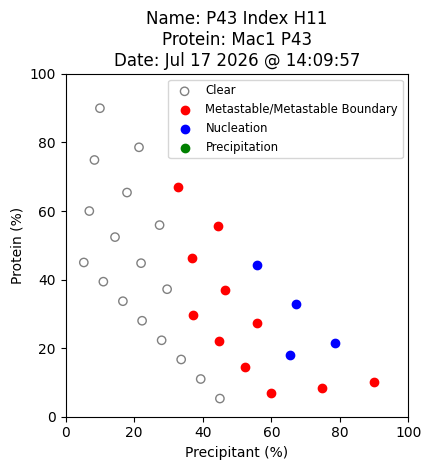
Figure 3. Scatter plot representation of Mac1 P43 phase diagram based on the condition from Index HT screening tray well H11.
What's next?
Further optimizations after the phase diagrams are currently in process. This includes fine-tuning PEG, salt, and pH concentrations, as well as finding the right seed concentration and scaling up microbatch drops. I plan to continue work on optimizing the crystals and collect their data during the fall beamtimes at CHESS. Additionally, I hope to work on solving the resulting crystal structures to analyze how the crystallization conditions affected the resulting structures and lattice dynamics. I’m looking forward to continuing work on this project and getting to experience the whole workflow of crystallography from screening to solving structures, while broadly deepening my understanding of biochemical and biophysical research.
References
Share article: